Products: Abaqus/CAE Abaqus/Viewer
Benefits: You can now open a model database in the Visualization module and display and query data from one of its models for a selected step. The ability to display the mesh, plot contours and symbols for model data such as force or pressure loads, and probe model data can help you refine your model before submitting an analysis.
Description: Abaqus/CAE now enables you to use the display and query functionality in the Visualization module to examine data from one of the models in the current model database before you perform an analysis. You can perform the following actions to investigate model data:
Display the mesh.
Display node and element labels.
Plot contours or symbols of selected loads, predefined fields, or interactions.
Probe the mesh or selected loads or predefined fields.
All models in the current model database are available for selection from the new Model Databases container of the Results Tree. You can expand the container for an individual model database to display or hide its part instances and to select the analysis step for which you want to investigate data. If you switch to another module and modify the selected model, Abaqus/CAE automatically reflects those changes in the Visualization module.
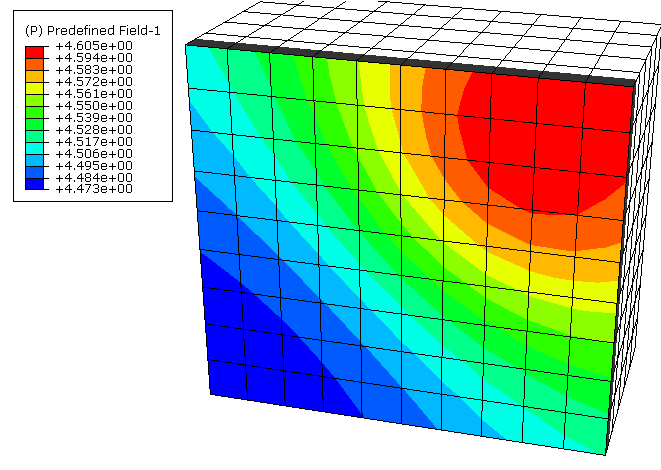
When you select a model and one of its analysis steps, you can plot contours or symbols for a selected load, predefined field, or interaction in that step by selecting that item as the current field output variable. The Field Output dialog box and the Field Output toolbar show the loads, predefined fields, and interactions that are included in the selected step, with the items in each category labeled with an (L), a (P), or an (I) respectively. Figure 3–5 shows a model in which a predefined field is shown with a contour plot.
Only a subset of the loads, predefined fields, and interactions that you can define in Abaqus/CAE are eligible for display in the Visualization module; refer to “Overview of results selection from the current model database,” Section 42.2 in the Abaqus/CAE User's Manual, for the full list. You can display attributes only when their propagation status is Created in this step, Propagated from a previous step, or Modified in this step. When an attribute is defined using an analytical field as a custom distribution or using a user-selected coordinate system, this aspect of its definition is also reflected in the display in the Visualization module. If your model includes a predefined field that is specified using a mapped field, the mapping data are included in the visualization as well.You can also perform queries of your model in the Visualization module and probe for model data from the current model database. Support for these options enables you to investigate aspects of your model such as the composition of the mesh throughout the assembly or to retrieve the specific node where a particular boundary condition is located.
When model data are displayed in the Visualization module, you can also color code the part instances and adjust your display of part instances using display groups.
Visualization module:
    Results Tree: Model Databases: Model name