Symbol plots allow you to visualize the magnitude and direction of vector and tensor variables in the form of symbols (arrows) superimposed on the model. Each symbol starts at the location in the model where the value was obtained; symbols representing nodal quantities appear at nodes, and symbols representing integration point quantities appear at integration points. The length of the arrow indicates the magnitude of the vector or tensor, and the direction of the arrow indicates its direction.
For example, in this section you will create a symbol plot of displacement. The symbol plot displays arrows representing the magnitude and the direction of the displacement vector at each node.
Use the Field Output toolbar to specify the variable you want to plot. When you select a symbol variable from the toolbar, the Visualization module automatically switches the display to plot symbols on the deformed model shape.
To create a symbol plot of nodal displacement:
From the list of variable types on the left side of the Field Output toolbar, select Symbol.
From the list of output variables in the center of the toolbar, select U (spatial displacement at nodes).
From the list of vector quantities and components on the right side of the toolbar, select Resultant as the vector quantity. This selection indicates that you want to plot the magnitudes of the displacement vectors.
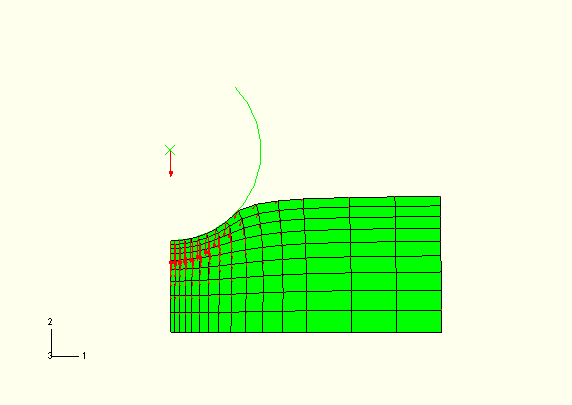
Abaqus displays the magnitude of the displacement vector on the deformed model shape on a symbol plot in the current viewport, as shown in Figure D–7.
Tip:
You can also display a symbol plot using the ![]() tool in the Visualization module toolbox or by selecting Plot
tool in the Visualization module toolbox or by selecting Plot![]() Symbols
Symbols![]() On Deformed Shape.
On Deformed Shape.
The arrows represent the total displacement at each node. The length of the arrow represents the magnitude of the displacement, and the direction of the arrow represents the direction of the displacement.
If your symbol plot is different from Figure D–7, you may have selected the incorrect output variable.
You will now customize your symbol plot by changing the visible edges and the arrow size and color.
To customize the symbol plot:
From the main menu bar, select Options![]() Common.
Common.
The Common Plot Options dialog box appears.
In the Common Plot Options dialog box, click the Basic tab if it is not already selected. Choose Wireframe for the render style and Feature edges for the visible edges.
From the main menu bar, select Options![]() Symbol.
Symbol.
The Symbol Plot Options dialog box appears.
In the Color & Style tabbed page, do the following:
Click the Vector tab.
Click the color sample ![]() .
.
Abaqus/CAE displays the Select Color dialog box.
Click the RGB tab and set the red, green, and blue values to 0, 255 and 255, respectively.
Tip: You can also select cyan from the colors near the bottom of the dialog box or use any of the other available selection methods.
Click OK to accept your selection and to close the Select Color dialog box.
Drag the Size slider to select 12 as the maximum length of the vector.
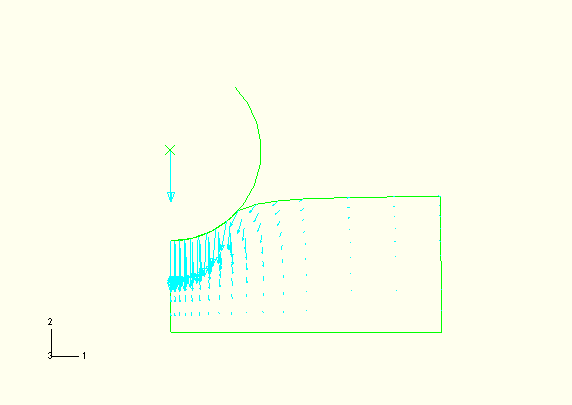
Click OK to apply your changes and to close the Symbol Plot Options dialog box.
The customized symbol plot appears, as shown in Figure D–8.