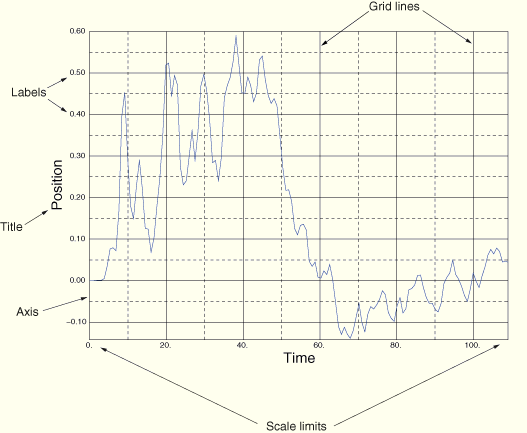
You can use the axis options to customize the appearance of the axes in an X–Y plot. Figure 43–36 identifies the X–Y plot characteristics that you can customize.
Abaqus/CAE provides access to these options from the Axis Options dialog box, which you can open from the following locations in the Visualization module:
From the main menu bar, select Options![]() XY Options
XY Options![]() Axis.
Axis.
From the Visualization module toolbox, click ![]() .
.
From the Results Tree, expand the X Axes or Y Axes container, highlight the axis or axes you want to modify, click mouse button 3, and select Axis Options from the list that appears.
With an X–Y plot displayed in the viewport, double-click one of the axes in the plot.
Items in an X–Y plot are selectable only when there is no active procedure in effect; you might have to cancel the current procedure to activate the components in an X–Y plot.
You can click the following tabs to customize the appearance of the selected axes:
Scale: Choose axes scales and limits and customize the occurrence of tick marks.
Tick Marks: Control the appearance and placement of tick marks.
Title: Specify the content and appearance of axes titles.
Axes: Choose axes placement, color, style, and thickness, and control numeric axes labels.