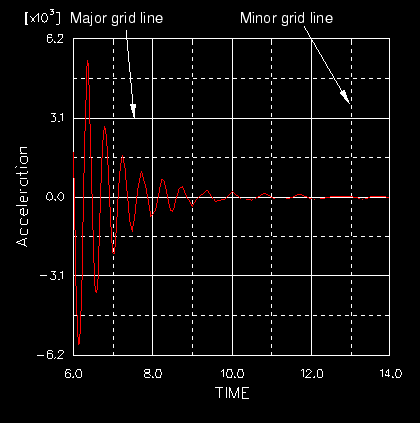
Click the Grid Display tab to control the appearance of the major and minor grid lines of an X–Y plot. Examples of major and minor grid lines are shown in Figure 43–42.
If your X–Y plot uses multiple axes in the same direction, Abaqus/CAE draws grid lines only for the axes of the first curve in the plot.The Grid Display options provide independent control over each of the four sets of grid lines; that is, independent control over the major and minor grid lines in either direction. You can display or hide any of the four sets, and you can modify the color, style, or thickness of the lines for any of the four sets of grid lines.
Note: Major grid lines originate from major tick marks, and minor grid lines originate from minor tick marks. To control the interval between grid lines, you must adjust the spacing of the tick marks.
To customize the grid display in an X–Y plot:
Locate the axis Grid Display options.
Select Options![]() XY Options
XY Options![]() Chart; or click
Chart; or click ![]() , which is located with the X–Y plotting tools in the Visualization module toolbox. Click the Grid Display tab in the dialog box that appears.
, which is located with the X–Y plotting tools in the Visualization module toolbox. Click the Grid Display tab in the dialog box that appears.
Select one or more X–Y plots to customize from the Charts field.
From the X Grid Lines options, toggle on the Major or Minor options to display major or minor vertical grid lines, respectively.
When either Major or Minor is on, grid line style, color, and thickness options become available for that type of grid line.
From the Y Grid Lines options, toggle on Major or Minor to display major or minor horizontal grid lines, respectively.
Repeat the following steps to customize the horizontal major and minor grid lines and the vertical major and minor grid lines:
Choose the color for the grid lines:
Click the color sample ![]() .
.
Abaqus/CAE displays the Select Color dialog box.
Use one of the methods in the Select Color dialog box to select a new color. For more information, see “Customizing colors,” Section 3.2.9.
Click OK to close the Select Color dialog box.
The selected grid lines change to the specified color.
Choose the line style:
Expand the style list to reveal the line style options (solid, dashed, etc.). The style list is the upper of the two unlabeled list options.
From the style list, click the desired line style.
The selected grid lines change to the specified style.
Choose the line thickness:
Expand the thickness list to reveal the line style options (solid, dashed, etc.). The style list is the lower of the two unlabeled list options.
From the thickness list, click the desired line thickness.
The selected grid lines change to the specified thickness.
Click Dismiss to close the Chart Options dialog box.